Quantitative bank intelligence & analytics

The risk of every U.S. bank, quantified

Proprietary grades, run-vulnerability scores, and peer analytics across 24 years of regulatory data — built by practitioners who needed answers the market wasn’t giving.

Request access Sign in
10,250
banks in the record
24 yrs
of history
605K
quarterly records
Quarterly
data refresh
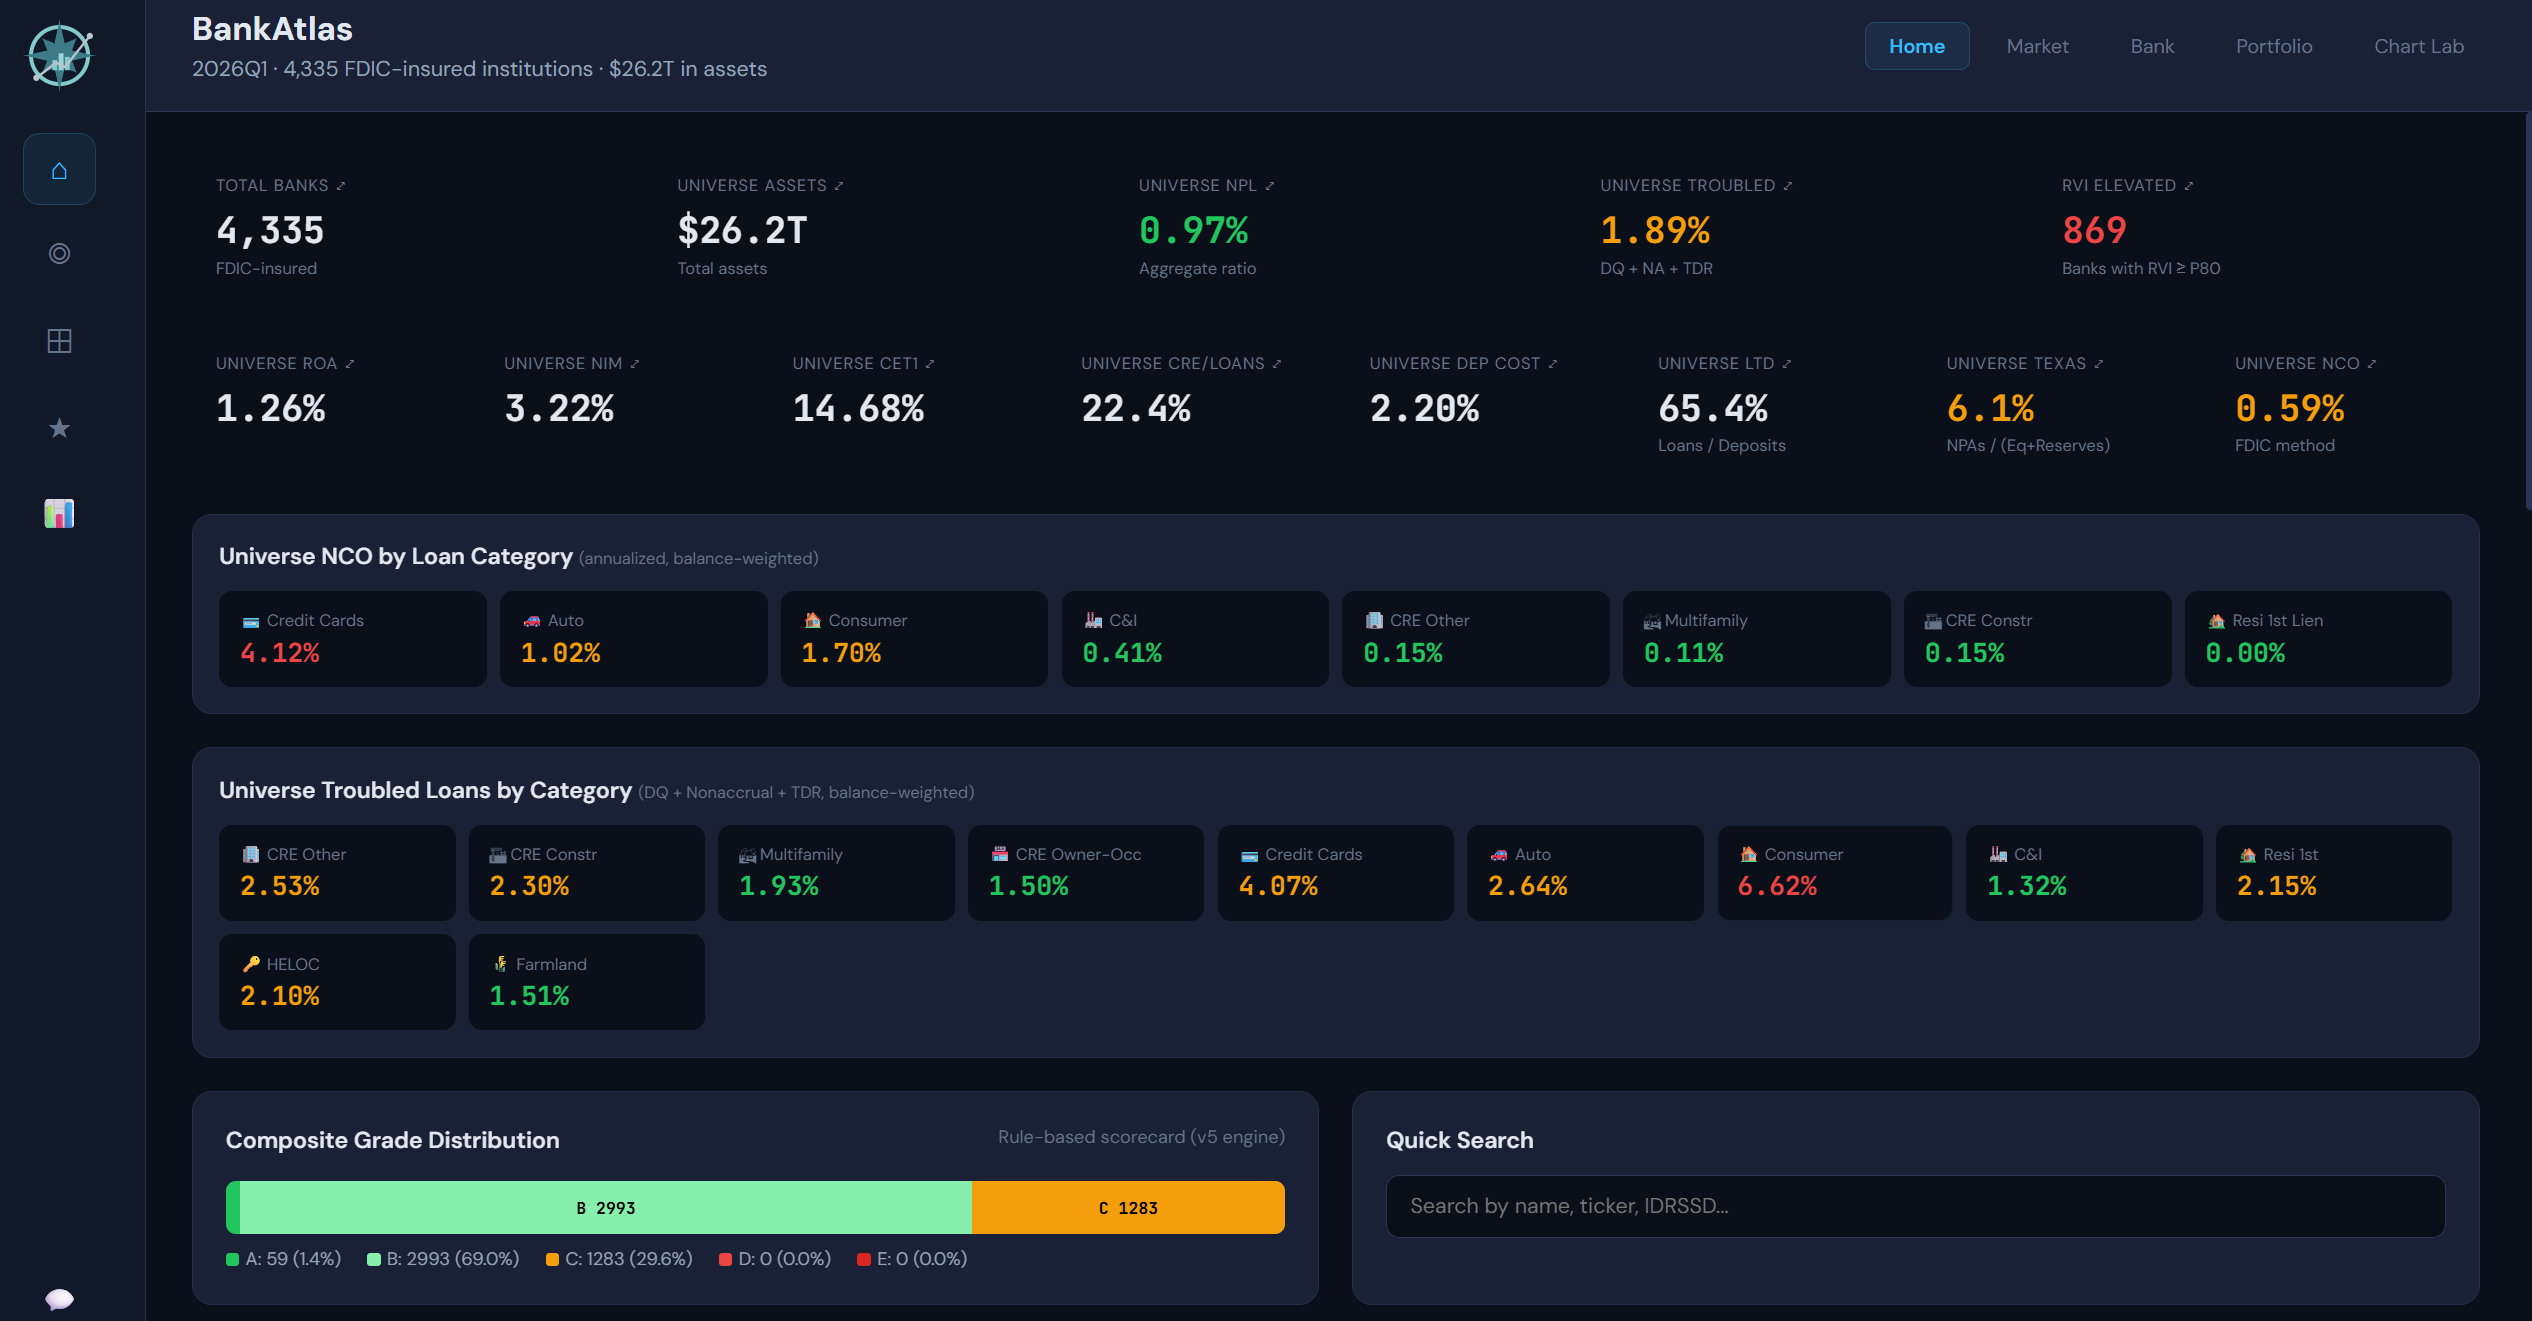
The platform

One lens, from filing to early warning

Everything an analyst needs to judge a bank — not just the raw data.

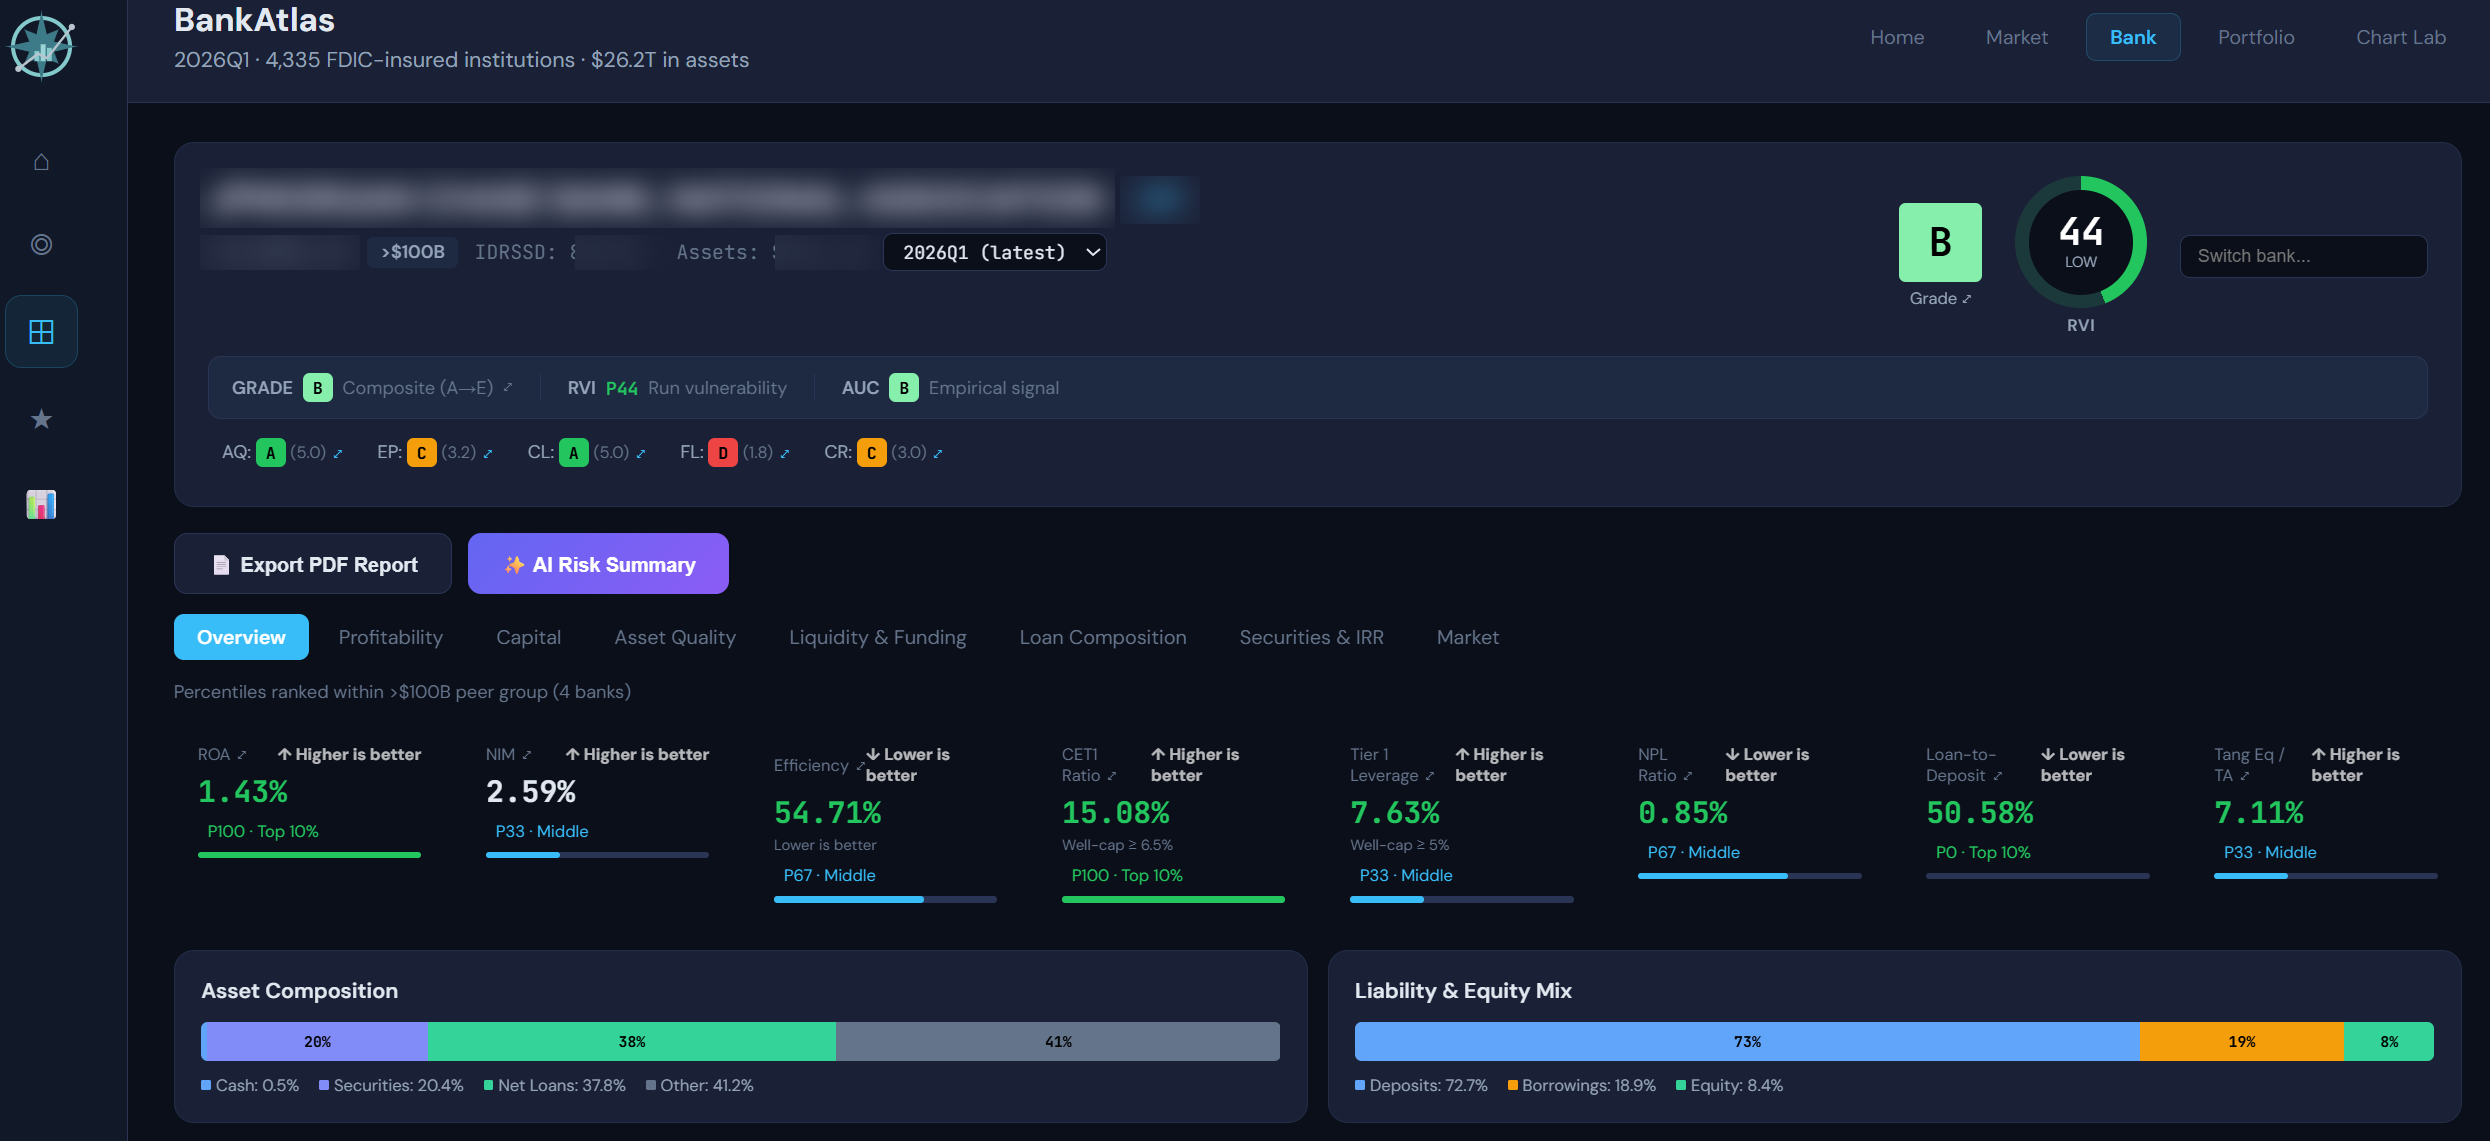
Composite grades

A–E grades across six risk dimensions, weighted by what has actually predicted failure — not analyst opinion.

Run-vulnerability index

The funding-fragility signal a clean grade can miss — scored on every bank, every quarter.

Peer comparison

Percentile bands against size-matched peer cohorts, so a community bank is judged against community banks.

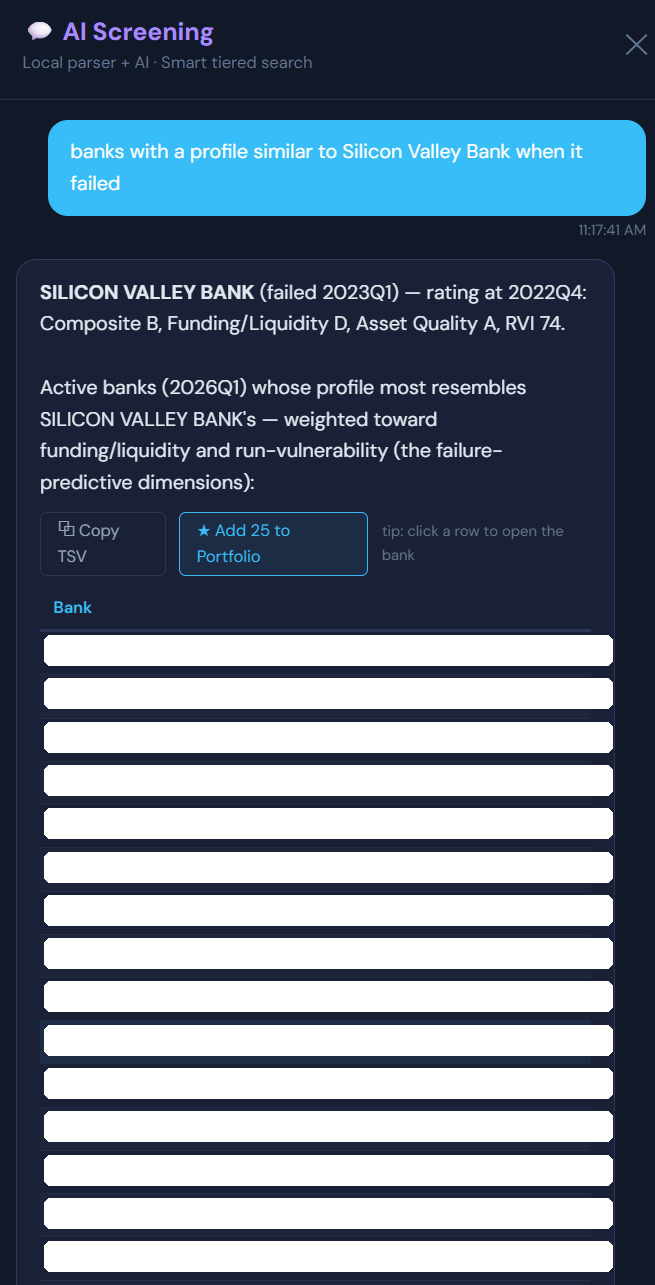
Ask in plain English

Ask anything about 600,000 bank-quarters

No query language to learn. Every answer is grounded in the real data — with the numbers shown so you can verify.

BankAtlas chat
Show me active banks that look like SVB did before it failed
Silicon Valley Bank — rating at 2022Q4: Composite B, Funding/Liquidity weak, RVI elevated. Active banks weighted toward the funding-fragility dimensions that drove the failure:
Bank
Comp
Fund/Liq
RVI
Example Regional Bank
B
D
94
Example Commerce Bank
C
D
91
Example Pacific Bank
B
C
88
Every row is a live query against the panel — illustrative names shown.
OR ASK ACROSS ANY DOMAIN
Screening Rankings History Market & momentum Quarter-over-quarter Grades & trends Subcategories
Most queries run locally — free & instant Complex queries use AI
And AI runs throughout the platform

AI risk summary

A plain-language read on any bank, exportable to PDF.

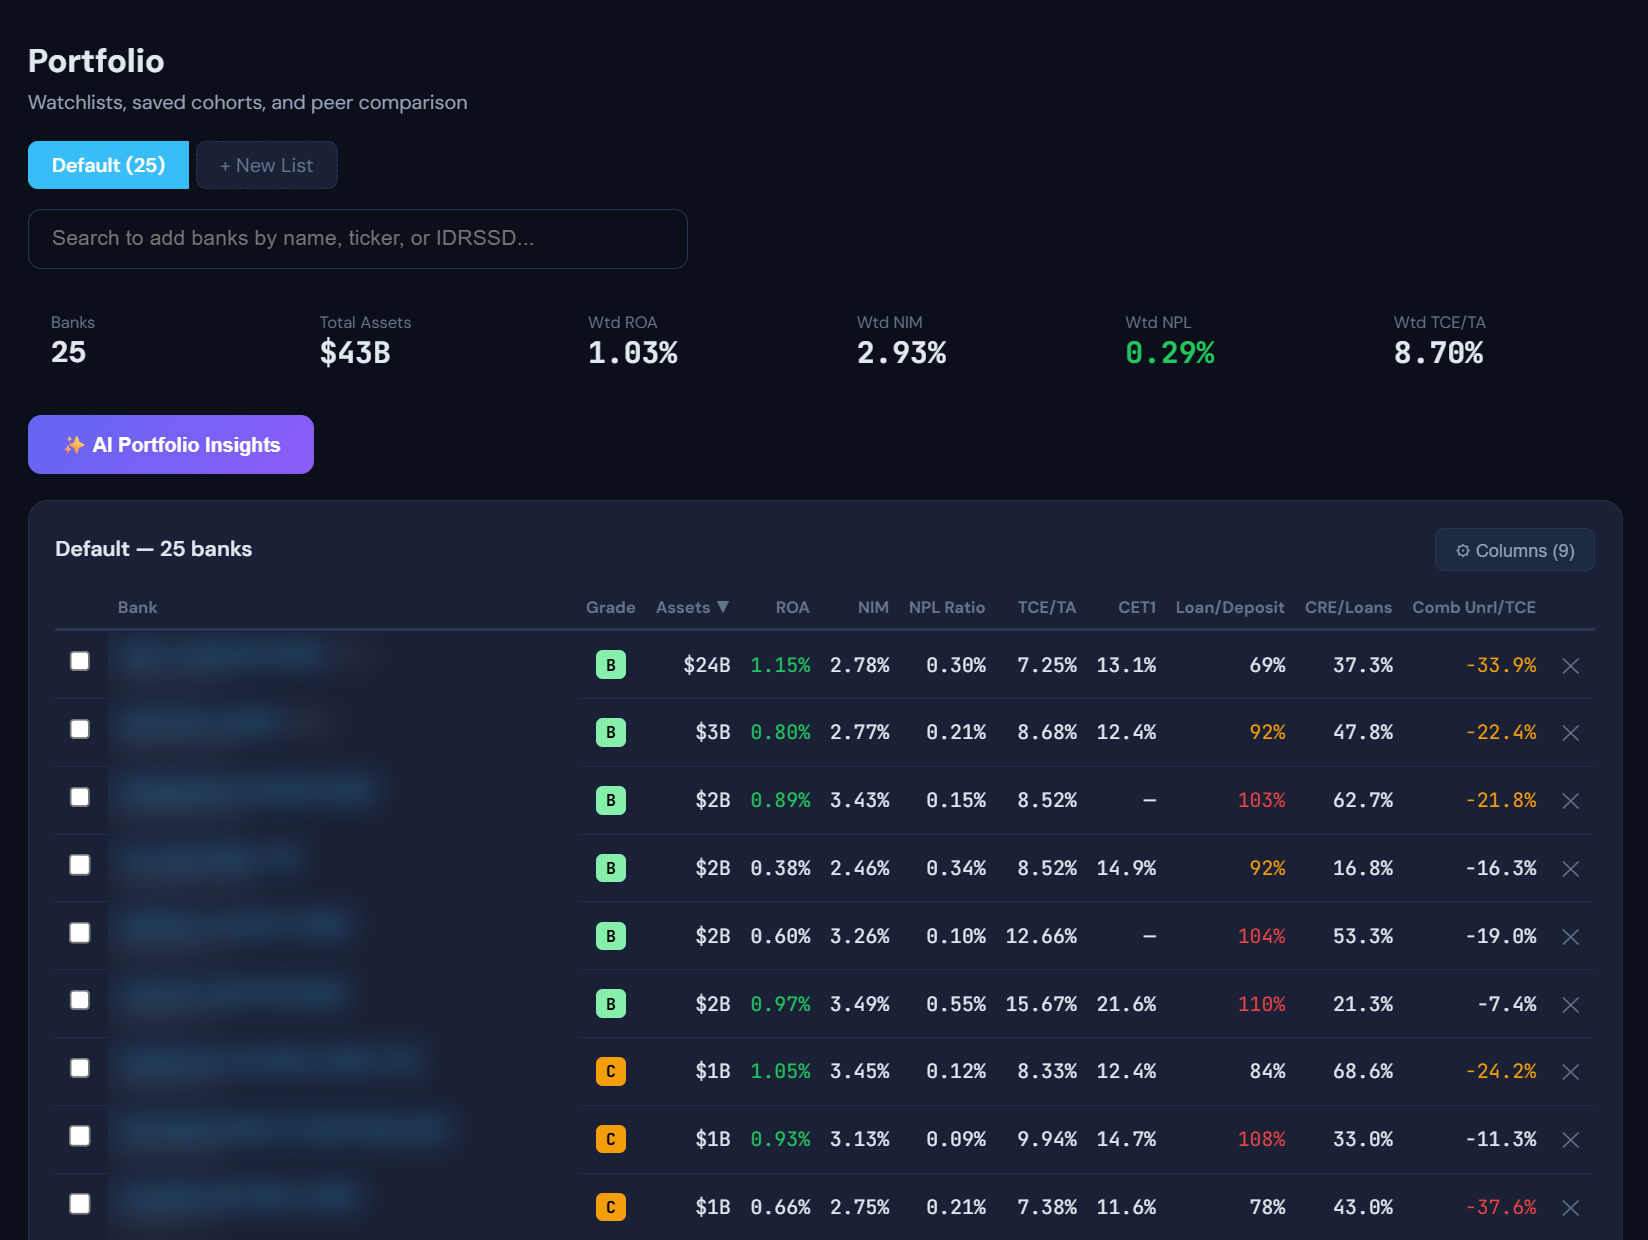
Portfolio insights

Weighted analytics and AI commentary across a watchlist.

Market brief

AI-surfaced FDIC, OCC, and Fed developments as they break.

“Bloomberg makes you learn its query language. BankAtlas speaks yours.”
Market intelligence · for investors

A momentum model built for capital allocation

Fundamentals tell you which banks are sound. Our proprietary momentum engine tells you where the market is moving — and turns it into a clear, actionable verdict on every traded bank.

True Momentum

The primary long / avoid signal — built from multi-horizon returns and relative strength versus the regional-bank index, confirmed by trend and volatility filters.

Trend Quality

A confidence overlay measuring how smooth and persistent a trend is, not just how strong — so a clean move outranks a noisy one.

Repricing Intensity

Isolates idiosyncratic moves stripped of market exposure — flagging catalysts and event risk regardless of direction.

Three scores, one clear call on every traded bank
Priority Long Leader Building Dead Money Breakdown Priority Avoid
Each bank is gated, benchmarked against the regional-bank index, and assigned one verdict — so a portfolio manager sees where to focus, not a wall of indicators.
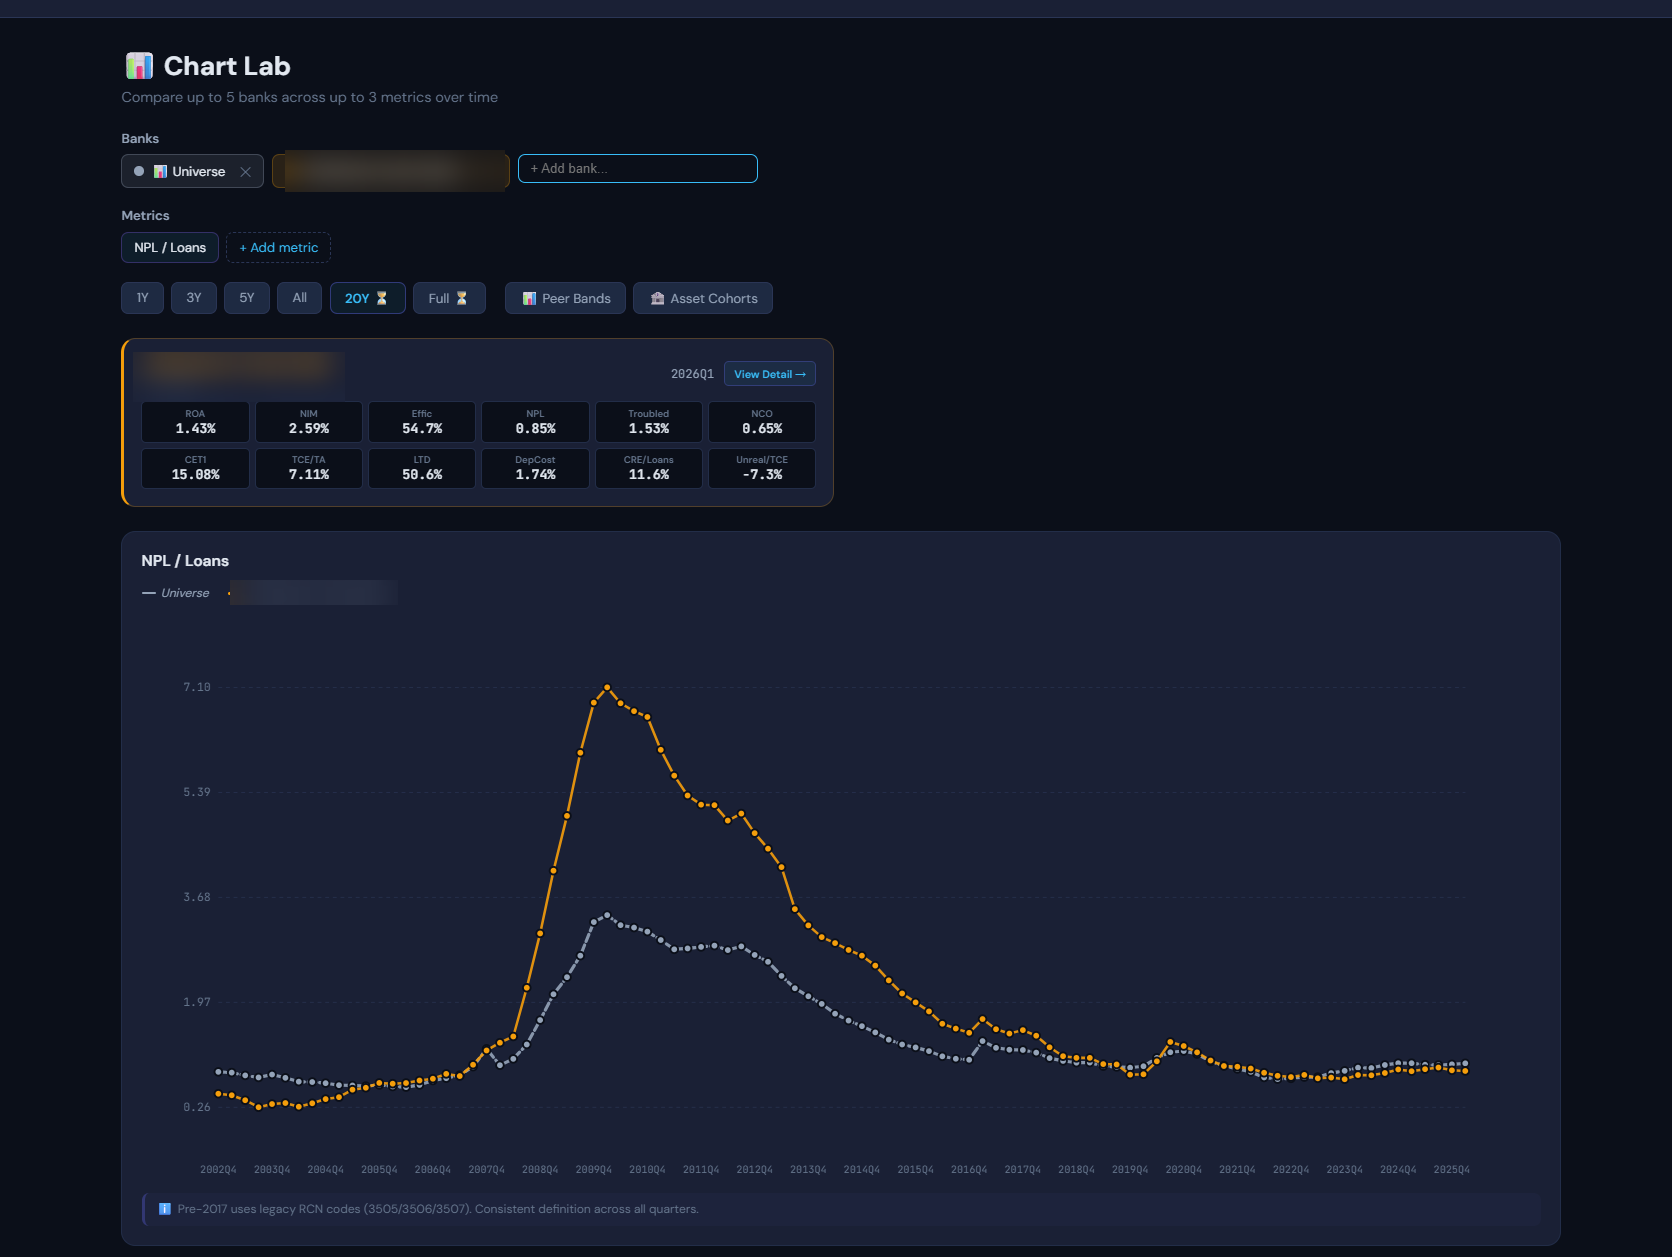
Chart Lab

Build any comparison across 20 years

Plot up to five banks across multiple metrics, overlay the system or a size-matched peer cohort, and see where any institution sits against its percentile bands.

JPM BAC WFC + bank Metric: NPL / Loans
2009 2005 2012 2026
JPM BAC WFC Peer band (P10–P90)
5 banks × multiple metrics Universe overlay Peer percentile bands Asset cohort comparison Up to 20 years
Portfolio construction

Build custom baskets on any metric

Construct and save your own bank portfolios — screened and weighted by any metric in the platform, including BankAtlas’s proprietary grades and scores. Track them, benchmark them, and revisit them each quarter.

Custom basket
High-grade regional lenders
Rule: Composite ≥ B  ·  RVI < 40  ·  Assets $1B–$50B  ·  equal-weight
Bank
Comp
RVI
Weight
Example Regional Bank
A
22
25%
Example Commerce Bank
B
31
25%
Example Pacific Bank
B
28
25%
Example Heartland Bank
A
19
25%
Saved · refreshes each quarter as new data files Saved basket
Any metric, incl. proprietary grades Rule-based screening Save & track over time Quarterly refresh
Validated, not opinion

Grades that are proven against real failures

Every grade is weighted by what has actually predicted bank distress across 20+ years — then back-tested against the historical record.

Lower grades fail far more often
Subsequent failure rate by grade — 597,000 rated bank-quarters, 2003–2026.
0.03%
0.08%
A
0.04%
0.11%
B
0.05%
0.22%
C
0.16%
0.56%
D
2.85%
4.82%
E
12-month failure rate 24-month failure rate
E-rated banks failed at roughly 86× the rate of A- and B-rated banks within a year — and the separation widens over 24 months (4.8% for E vs ~0.1% for A and B). The signal holds, and deepens, over time.
Verified in the field

Caught early: the 2023 regional-bank crisis

Both lenses, examined as of the quarters before each receivership — using the same model that runs today.

First Republic BankFailed May 2023
Composite grade
E → D
flagged from 2021
Run-vulnerability
100th
by Q1 2023
Carried a bottom-tier grade for two years, with run-vulnerability climbing into the 80s through 2022 and peaking at the 100th percentile just before receivership.
Silicon Valley BankFailed Mar 2023
Composite grade
B
looked healthy
Run-vulnerability
elevated
funding fragility
The composite grade said healthy — a B to the end. The run-vulnerability lens disagreed, flagging the funding fragility the headline grade missed.
First Republic was caught by the grade; SVB only by the run-vulnerability lens. Monitoring both flags both kinds of fragility.
Read the full methodology
Our complete white paper on the validated risk model.
Download →
Why BankAtlas

Built by practitioners — not a rating agency

BankAtlas began with a problem the market wasn’t solving: bank risk that wasn’t being measured until it was too late.

It started before 2008. In the years leading up to the financial crisis, our founder — a veteran investor and portfolio manager — was analyzing U.S. banks and saw what the market was missing — risk that the established players weren’t effectively measuring or pricing. The crisis proved the point. So the work began: building a dataset, quarter by quarter, that didn’t exist anywhere else.

Over nearly two decades, that dataset grew into a quantitative engine for gauging the risk of every U.S. bank — individually and across the system — through proprietary grades and scores. It was refined across real market cycles, from 2008 to the regional-bank failures of 2023, and built to answer the questions that actually matter about a bank’s profile.

2023 was the proof. When the regional-bank crisis hit, the system was already flagging the trouble. First Republic had carried a bottom-tier composite grade since 2021 — more than two years before it failed — and its run-vulnerability had climbed to the top of its peer group by early 2023. Silicon Valley Bank, whose composite looked healthy to the end, was caught by the second lens: a run-vulnerability signal pointing to the funding fragility the headline grade missed. The same models that flagged them then are the ones that run on every bank today.

BankAtlas is a fintech, not a rating agency. We don’t issue credit ratings, and we don’t give investment advice — we provide quantitative, data-driven bank intelligence, now enhanced with AI that makes our proprietary grades queryable and interpretable. Built by practitioners, for the analysts, investors, and bankers who ask the same questions we do.

JWC
Jonnathan Wong-Coronel
Founder, BankAtlas · A veteran investor and portfolio manager who has analyzed U.S. banks since before the 2008 crisis; two decades building quantitative bank-risk models.
BankAtlas provides quantitative analytics and information for its subscribers’ own use. It is not a credit rating agency, and nothing on this platform is investment advice or a recommendation regarding any institution or security.
Who it’s for

Built for everyone who needs to judge a bank

One platform, several very different questions — from a bank’s own risk team to the investors and counterparties sizing it up from the outside.

Bank executives & risk teams

CEOs, CFOs, risk & credit officers

See your own bank the way the market sees it: composite grade, run-vulnerability, and every risk dimension — benchmarked against a size-matched peer set, quarter over quarter. Know where you stand before anyone else asks.

Investors & analysts

Hedge funds, asset managers, equity analysts

Screen every bank by grade, funding fragility, or any metric; layer in the momentum engine; and build custom baskets weighted on proprietary signals. Query 600,000+ bank-quarters in plain English and export the read.

Treasury & counterparty risk

Corporate treasurers, counterparty managers

Monitor the banks you hold deposits with or trade against. Track grades and run-vulnerability on a watchlist, flag funding fragility early, and see concentration across your counterparties before it becomes a problem.

Fintechs, borrowers & corporates

Fintech partners, corporate borrowers, real-estate investors

Find a bank that actually lends to your business. Search the full U.S. banking universe by lending focus and geography — say, banks active in multifamily or CRE lending in your state — then vet each candidate’s health before you approach them.

Regulators & supervisors

Examiners, policy & supervisory staff

An independent, quantitative read across the entire banking system: peer-relative grades, funding-fragility signals, and 20 years of history on any institution or cohort — a fast, consistent lens for surveillance and early-warning work.

Pricing

Straightforward for banks. Tailored for institutions.

Transparent, asset-tiered annual pricing for banks benchmarking against peers. Custom plans for investment and corporate use.

For banks · benchmark against peers
Community
Under $1B
$2,500/yr
Most common
Small regional
$1B–$10B
$5,000/yr
Large regional
$10B–$100B
$10,000/yr
Enterprise
Over $100B
Custom
Contact sales →
Institutional & investment
Multi-bank screening, market signals, and full API access — for investors, corporates, and advisors.
Custom pricing
Contact sales →

See your bank’s grade

Independent, quant-driven bank intelligence — built by practitioners on public regulatory data.

Request access →